
New Data: Did the Keller ISD Split Scare Off Homebuyers?
This report analyzes the number of showings scheduled by home buyers before and after the split announcement.
Bottom line: Buyers haven’t slowed down
While property values provide long-term insight into the effects of the Keller ISD split, short-term market sentiment can be gauged by analyzing home-showing activity. Showings serve as an early indicator of buyer interest and market confidence, making them a valuable metric for detecting immediate shifts in consumer behavior.
To assess whether the Keller ISD split announcement on January 9, 2025, influenced homebuyer interest, we analyzed showing data beginning in early January. Given that showings are scheduled using two different services (BrokerBay and ShowingTime), our focus is not on absolute accuracy but on consistency—tracking proportional changes in showing volume within Keller ISD compared to neighboring districts and historical trends.
By examining week-over-week and year-over-year percentage changes, we can determine whether uncertainty surrounding the split has affected buyer activity. While early data suggested a decline in showings, subsequent weeks showed fluctuations, making it clear that multiple factors are at play.
This study aims to provide insight into how uncertainty—not just the split itself—may influence buyer behavior in real time.
Key Clarification: Showing Data and Scheduling Platforms
While our analysis provides a reliable measure of percentage-based trends, it is important to acknowledge that absolute showing numbers may be affected by agent behavior rather than just market demand.
Real estate agents in Keller ISD and surrounding areas have access to two different showing platforms: BrokerBay and ShowingTime. If more agents start favoring one platform over the other, the raw number of showings in MLS reports could be skewed.
Why This Doesn’t Affect the Validity of the Analysis
- Percentage-based trends remain reliable because we are comparing relative changes within the same dataset.
- Any shift in platform usage would likely be gradual, rather than an abrupt change tied to the ISD split.
- Comparing KISD to neighboring ISDs helps control for overall market conditions.
Therefore, while the raw number of showings should not be viewed as absolute, the percentage changes remain a valid reflection of buyer demand trends.
Year-Over-Year Showing Activity: Keller ISD vs. Neighboring Districts
The table below summarizes the percentage change in showings for Weeks 1–9 of 2024 vs. 2025 across Keller ISD and five surrounding school districts:
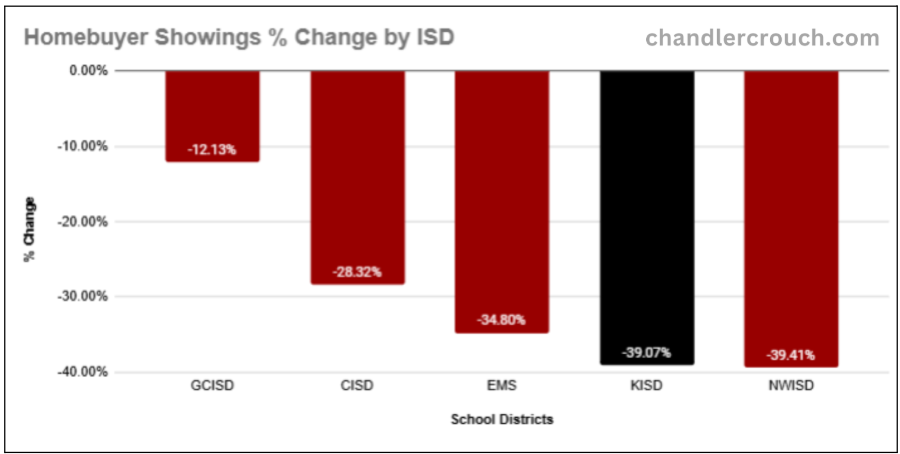
Key Takeaways
- All ISDs have fewer showings in 2025 compared to 2024.
- KISD is down -39.07%, a decline similar to NWISD (-39.41%).
- BISD has the largest drop (-47.90%), while GCISD has the smallest (-12.13%).
- While Keller ISD’s drop is significant, it is not the most extreme decline.
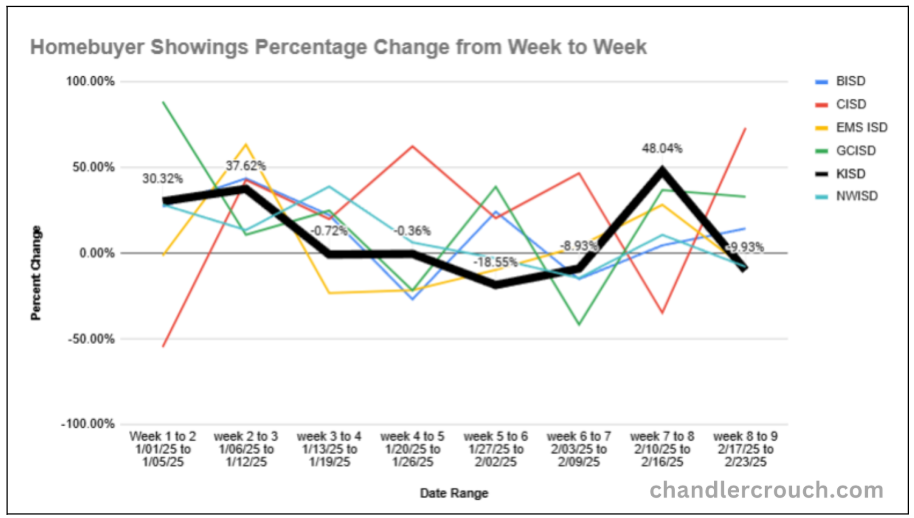
Week-to-Week Showing Trends in 2025
To further analyze the impact of the ISD split, we tracked week-to-week percentage changes for all six ISDs from Week 1 to Week 9 of 2025.
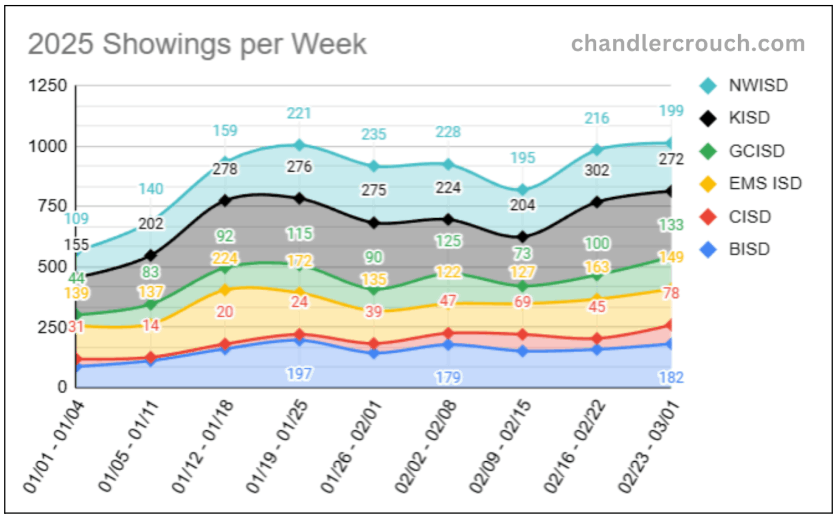
This chart shows the absolute number of showings in each ISD per week in 2025.
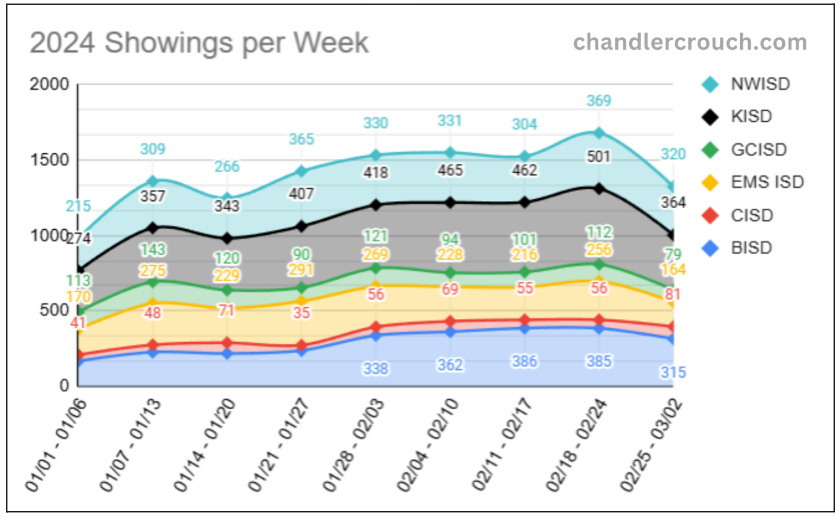
This chart shows the absolute number of showings in each ISD per week in 2024
This chart shows the absolute number of showings in each ISD per week in 2023

Conclusions & Next Steps
- Keller ISD’s showing decline is notable (-39.07%) but aligns with other ISDs in the area.
- No single event explains the drop—broader market trends may be contributing factors.
- KISD’s weekly trends show fluctuations, rather than a straight-line decline.
- The uncertainty surrounding the KISD split may have played a role, but other economic conditions (e.g., interest rates) could also be factors.
What’s Next?
- Continue monitoring showings beyond March to see if trends stabilize.
- Track contract activity to see if showing declines translate to lower sales.
- Survey local agents & buyers for qualitative insights on the ISD split’s impact.
Final Thoughts
While Keller ISD’s showing decline is significant, the broader market also experienced declines. The ISD split may be one contributing factor, but it is not the sole explanation for reduced buyer activity.
Prepared By:
Chandler Crouch Realtors